C.I.S. 1110 (Science Section)
Professor Langsam
Assignment #3
When an atom absorbs a quantum of energy, it is said to be in an excited state relative to its normal (ground) state. When an excited atom returns to the ground state, it emits light. For example, the familiar red light of neon signs is due to neon atoms which have been excited by an electrical discharge. When light from excited atoms is viewed through a spectroscope, images of the slit appear along the scale of the instrument as a series of colored lines. The various colors correspond to light of definite wavelengths, and the series of lines is called a line spectrum. The line spectrum of each element is so characteristic of that element that its spectrum may be used to identify it.
The spectrum of hydrogen is particularly important in astronomy because most of the universe is made of hydrogen. Emission or absorption processes in hydrogen give rise to series, which are sequences of lines corresponding to atomic transitions, each ending or beginning with the same atomic state in hydrogen. Thus, for example, the Balmer Series involves transitions starting (for absorption) or ending (for emission) with the first excited state of hydrogen, while the Lyman Series involves transitions that start or end with the ground state of hydrogen; the adjacent image illustrates the atomic transitions that produce these two series in emission. The various series of lines are named according to the lowest energy level involved in the transitions that give rise to the lines.
The Lyman series involve jumps to or
from the ground state (n=1); the Balmer series (in which all the
lines are in the visible region) corresponds to n=2, the Paschen series to n=3, the Brackett series to n=4, and the Pfund series to n=5.
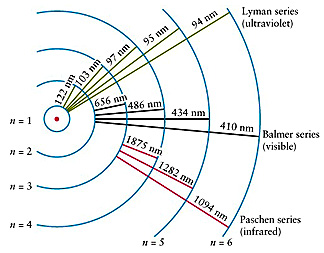
The
Lyman series is in the ultraviolet while the Balmer series is in the visible
and the Paschen, Brackett, Pfund, and Humphreys series are in the infrared.
In 1914, Niels Bohr proposed a theory of the hydrogen atom which explained the origin of its spectrum and which also led to an entirely new concept of atomic structure. According to this theory, the wavelengths of the hydrogen spectrum could be calculated by the following formula known as the Rydberg formula:
Where
λvac is the wavelength
of the light emitted in vacuum
in units of cm,
RH is the Rydberg constant
for hydrogen (109,677.581 cm-1),
n1 and n2
are integers such that n1 < n2,
By
setting n1 to 1 and letting n2 run from 2 to infinity, the spectral
lines known as the Lyman series converging to 91nm are obtained. In the same manner, the other series of
spectral lines may be obtained using the values of n1
and n2 in the following table:
|
n1 |
n2 |
Name |
Converge toward |
|
1 |
2 → ∞ |
91nm |
|
|
2 |
3 → ∞ |
365nm |
|
|
3 |
4 → ∞ |
821nm |
|
|
4 |
5 → ∞ |
1459nm |
|
|
5 |
6 → ∞ |
2280nm |
|
|
6 |
7 → ∞ |
3283nm |
Using a set of nested for-loops, write a C++ program to print a neatly labeled and formatted table of the wavelengths of the first 10 spectral lines in each of the above series for hydrogen. Be sure your program is neatly formatted and commented as discussed in class. Note that this program does not use any input data.